Configure L7 logs
Big picture
Deploy Envoy and use Calico Enterprise L7 logs to monitor application activity.
Value
Just like L3/4 Calico Enterprise logs, platform operators and development teams want visibility into L7 logs to see how applications are interacting with each other. Calico Enterprise flow logs only display which workloads are communicating with each other, not the specific request details. Calico Enterprise provides visibility into L7 traffic without the need for a service mesh.
L7 logs are also key for detecting anomalous behaviors like attempts to access applications, restricted URLs, and scans for particular URLs.
Concepts
About L7 logs
L7 logs capture application interactions from HTTP header data in requests. Data shows what is actually sent in communications between specific pods, providing more specificity than flow logs. (Flow logs capture data only from connections for workload interactions).
Calico Enterprise collects L7 logs by sending the selected traffic through an Envoy proxy.
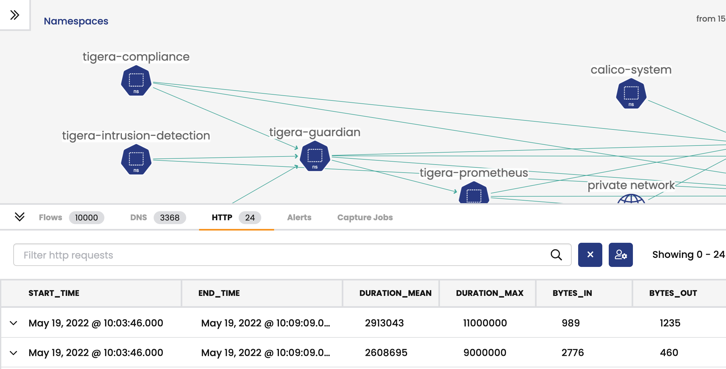
L7 logs are visible in the Manager UI, service graph, in the HTTP tab.
Before you begin
Not supported
- GKE
Limitations
- L7 log collection is not supported for host-networked client pods.
- When selecting and deselecting traffic for L7 log collection, active connections may be disrupted.
Log storage requirements
L7 logs require a minimum of 1 additional GB of log storage per node, per one-day retention period. Adjust your Log Storage before you start tasks in the next section.
How to
Configure Felix for log data collection
Enable the Policy Sync API in Felix.
For cluster-wide enablement, modify the
defaultFelixConfiguration and set the fieldpolicySyncPathPrefixto/var/run/nodeagent.kubectl patch felixconfiguration default --type='merge' -p '{"spec":{"policySyncPathPrefix":"/var/run/nodeagent"}}'Configure L7 log aggregation, retention, and reporting.
For help, see Felix Configuration documentation.
Configure L7 logs
In this step, you will configure L7 logs, select logs for collection, and test the configuration.
Configure the ApplicationLayer resource for L7 logs
Create or update the ApplicationLayer resource named,
tigera-secureto include a logCollection section of the file,_api.htmlhere.Ensure that the
collectLogsfield is set toEnabled.Example:
apiVersion: operator.tigera.io/v1
kind: ApplicationLayer
metadata:
  name: tigera-secure
spec:
  logCollection:
    collectLogs: Enabled
    logIntervalSeconds: 5
    logRequestsPerInterval: -1
Apply the resource. This creates
l7-log-collectordaemonset incalico-systemnamespace.Ensure that the daemonset progresses and
l7-collectorandenvoy-proxycontainers inside the daemonset are in aRunningstate.
Select traffic for L7 log collection
Annotate the services you wish to collect L7 logs as shown.
kubectl annotate svc <service-name> -n <service-namespace> projectcalico.org/l7-logging=trueTo disable the L7 log collection, remove the annotation.
kubectl annotate svc <service-name> -n <service-namespace> projectcalico.org/l7-logging-
After annotating a service for L7 log collection, only newly-established connections through that service are proxied by Envoy. Connections established before the service is annotated are not proxied or interrupted, and no logs are generated.
Conversely, when a service is deselected, any previous connections established through the annotated service continue to be proxied by Envoy until they are terminated, and logs are generated.
Test your configuration
Identify the path to access your cluster. Where
<path>can be:- Public address of your cluster/service or
- Cluster IP of your application's service (if testing within the cluster)
curlyour service with a command similar to the following. You will seeServerheader asenvoy.curl --head <path to access service>:<optional port>/<path>
View L7 logs in Manager UI
Service Graph
To view L7 logs in Service Graph:
In the Manager UI left navbar, click Service Graph.
In the bottom pane you will see L7 logs in the HTTP tab.
Kibana
To view L7 logs by index pattern in Kibana:
In the Manager UI left navbar, click Kibana.
In the new Kibana browser, click the hamburger icon in the top left corner, and select Analytics, Discover.
Select the index pattern,
tigera_secure_ee_l7.